 Active Metrics
Data Screens
How data pages work
Every sport has its own vertical stack of pages you swipe through mid-workout: a customizable data grid, metric-specific focus pages, and — for outdoor sports — a live map. Each sport remembers its own layout, fields, and page set, so your running screens don’t affect your rides.
Grid layouts
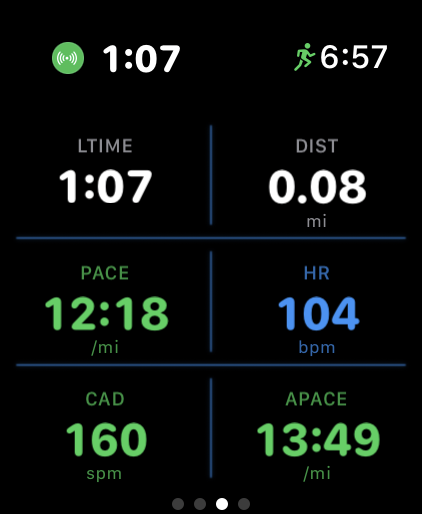
The data grid comes in five layouts:
| Layout | Fields | Shape |
|---|---|---|
| 2×2 Large | 4 | Two rows of two, big numbers |
| 3×2 Standard | 6 | Three rows of two (the default for most sports) |
| 4×2 Dense | 8 | Four rows of two, max density |
| Hero + 4 | 5 | One full-width field on top, 2×2 below |
| Hero Top & Bottom | 4 | Full-width top and bottom, two fields between |
Full-width “hero” cells get extra room and show a live graphic under the number — a zone bar for heart rate and power, a sparkline for pace and cadence, a mini elevation profile, and so on.
Data fields
There are nearly 30 built-in fields to slot into the grid. Roughly by category:
- Time & distance — duration, lap time, distance, lap distance
- Pace & speed — current, average, and lap pace, grade-adjusted pace, speed, average speed, swim pace
- Heart rate — heart rate, HR zone
- Power — power, average, normalized, and max power, air power
- Cadence & form — cadence, stride length
- Elevation — gain, loss, altitude, grade, vertical speed
- Other — calories, compass, activity rings
Some fields only appear for sports where they make sense, so the picker never offers swim pace on a bike ride.
Editing fields and pages
Change a field mid-workout: long-press any grid cell. A picker of available fields for the sport pops up — tap one and it replaces the cell, saved for future workouts.
Change layout and pages: on a sport’s pre-start screen, swipe right to its screen settings; mid-workout, go to the Settings page → Pages & Layout. Pick a grid layout and toggle individual pages on or off. The data grid itself is always on. Hiking adds compass options here (the two center fields and the off-route haptic).
Focus pages
Each focus page is a full screen for one metric:
- Heart Rate — big BPM reading over a five-zone bar with your position in the zone and time in zone.
- Pace — pace trend sparkline with an average-pace line and your fastest/slowest marks.
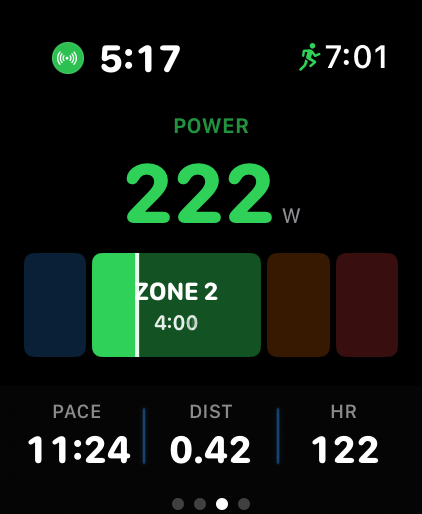
- Power — watts over a four-zone bar with time in zone.
- Cadence — cadence sparkline with your target-range lines drawn on it.
- Elevation — profile of your climb so far, colored by grade, with total gain and loss.
- Compass — heading and cardinal direction; long-press to lock a bearing and get turn-back-on-course cues, plus a heading-up route ring when navigating a route.
Metric coloring
Live numbers tint themselves so you can read effort at a glance. Heart rate uses the full five-zone palette (Z1 blue, Z2 green, Z3 yellow, Z4 orange, Z5 red) and power uses four zone colors (easy blue, moderate green, hard orange, above-max red) — both based on the zones in watch Settings → Zones & Targets. Other targeted metrics are simpler three-state colors:
| Metric | Green | Yellow | Red |
|---|---|---|---|
| Pace | Faster than average | — | Slower than average |
| Cadence | In target range | Just below target | Well below target |
| Vertical speed | Climbing | — | Descending |
Defaults by sport
Running starts on the 3×2 grid with lap time, distance, current pace, heart rate, cadence, and average pace, plus pace, heart rate, power, cadence, and elevation focus pages and the live map.
Indoor cycling is power-first: no GPS means no map or elevation pages. The default 3×2 grid shows lap time, distance, power, heart rate, cadence, and speed, with power, heart rate, and cadence focus pages — all fed by a paired trainer or sensors.
Strength training leads with the Sets page (see Workouts) followed by a simplified grid — by default the Hero Top & Bottom layout with heart rate up top, set time and calories in the middle, and your activity rings below. No pace, distance, or elevation fields.
The other seven sports follow the same pattern with sport-appropriate defaults — hiking leans on elevation and compass, open water swimming on swim pace, and so on.
Reset and units
To throw away your customizations, use watch Settings → Data Screens → Reset to Defaults. It resets every sport’s grid back to stock.
Units live in Settings → Units on the watch and in the Settings tab on iPhone — the two sync through iCloud. Switching between metric and imperial changes every field’s display: distance in km or mi, pace in min/km or min/mi, elevation in m or ft, and strength weights in kg or lb.